Competition, competition, competition.
I think I have been naughty. I have completed the creation of the Big.TOE spec ready for formal sign-off… and I did it before looking in detail at the competition. Hmm, naughty indeed.
“But, but, but, I was really busy and everything was…” SHUT UP! Leave the excuses and move on. As it turns out we’re safe, and this is due to Big.TOEs collaborative element. Big.TOE had been guided by colleagues into a niche that not only exists, but suits our ethics here at Connected.
Phew, thanks guys!
So I spent a day looking at the competition in detail, and then sighed with relief. They are all so complicated. Even the free stuff. You’ve got to spend hours of annoying time-waste to get the answer to the simple question “How well are banners doing?”. And when you get the answer you’re surrounded by an infinite number of ways to see it. Very very naff and annoying.
Another ‘sigh-of-relief-inducer’ is that they nearly all use third-party cookies which a visitor can opt out of. Woah. What a way to undermine your reporting. Cue shameless Big.TOE plug:
- Big.TOE is server side reporting, so no third-party cookies.
- Big.TOE follows the principle of KISS (Keep It Simple Stupid) and will be bloody easy to use!!
So bring on the competition!
—-
This week we also delved a layer deeper into the inner workings of Big.TOE and gulped again.
Actually it doesn’t look too bad. We have a list of features for the first release and a technical plan (first draft) of how it will be achieved. There is some stuff to learn (like xml and excel) but it should piece together fine. The eye opener is how much bigger things look when you go deeper, it really is like descending from 30,000 ft.
—-
Well, now I have just gone and changed everything.
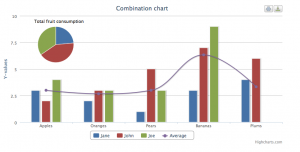
We – almost all of the company techs – were unanimously decided to base Big.TOE on XML. XML was to be the glue to stitch the different parts together. But now I have found something called Highcharts, which is just luuurvely. Its a 100% JavaScript graph building suite… and its luuurvely.
Highcharts is very attractive for many reasons; here are the main ones:

- The graphs are just ace. The graphs are really really really ace!
- Its on the front end, offering tasty interaction between the graphs and the clients
- Very flexible with the data sent to them.
- Its JavaScript, giving opportunity to develop it, or tweak it.
- The graphs are just ace.
It can work with xml, but it doesn’t off the shelf. Now I want to use this, cos I like it. So I just have to persuade everyone else to agree to its loveliness. We can keep xml – if we still want it – for later upgrades. Trust me 😉

